
truestar inc. point every month
Summary
This dataset includes the monthly meteorological data edited by truestar based on the long-term historical meteorological data provided by Japan Meteorological Agency.
Sample Data
Features/Usages
We provide the monthly meteorological data such as temperatures, rainfall amount, wind speeds and sunlight hours observed by Japan Meteorological Agency from January,2011 up to the previous month. We removed text data included in numeric columns and cleansed the original data. Additionally, we added latitude, longitude, and the prefecture information of observatories. You can analyze the data immediately and easily.
Data Fields
| BLOCK_CODE |
| OBSERVATORY_NAME |
| OBSERVATORY_TYPE |
| OBSERVATION_DATA |
| PREF_CODE |
| PREF_NAME |
| JMA_AREA_CODE |
| JMA_AREA_NAME |
| LATITUDE |
| LONGITUDE |
| DATE |
| AIR_PRESSURE |
| AIR_PRESSURE_SEA_LEVEL |
| RAINFALL |
| RAINFALL_MAX_DAILY |
| RAINFALL_MAX_1H |
| RAINFALL_MAX_10MIN |
| AIR_TEMPERATURE |
| AIR_TEMPERATURE_DAILY_MAX_AVERAGE |
| AIR_TEMPERATURE_DAILY_MIN_AVERAGE |
| AIR_TEMPERATURE_MONTHLY_MAX |
| AIR_TEMPERATURE_MONTHLY_MIN |
| HUMIDITY |
| HUMIDITY_MIN |
| WIND_SPEED |
| WIND_SPEED_MAX |
| WIND_SPEED_MAX_DIRECTION |
| WIND_SPEED_INSTANTANEOUS_MAX |
| WIND_SPEED_INSTANTANEOUS_MAX_DIRECTION |
| SUNLIGHT_HOURS |
| GLOBAL_SOLAR_RADIATION |
| SNOWFALL |
| SNOWFALL_MAX_DAILY |
| SNOWFALL_DEEPEST |
| CLOUDAGE |
| SNOWFALL_DAYS |
| FOG_DAYS |
| THUNDER_DAYS |
| POINT_OBSERVATORY |
References
Edited by truestar based on the following data:
JMA(Japan Meteorological Agency) meteorological observation data
https://www.data.jma.go.jp/obd/stats/etrn/
MLIT (Ministry of Land, Infrastructure, Transport and Tourism) digital national land information
https://nlftp.mlit.go.jp/ksj/gml/datalist/KsjTmplt-N03-v3_0.html
Special Notes
■ When visualization in Tableau
This dataset includes point data “POINT_OBSERVATORY”. Since there are many records, it might take a lot of times to visualize with mapping.
measure➀
You can create a mapping speedily by making the point data from latitude/longitude information on Tableau.
You can use “makepoint([LATITUDE], [LONGITUDE])” function at calculated field.
measure➁
You can create a mapping speedily by extracting data at Snowflake on Tableau. In this case, you should update the extracted file suitably.
■ About each statistiics
Numerical data=”0″ includes the data under 0.5.
“Null” does not mean “0”, but it means that it was excluded from the observation or could not be observed.
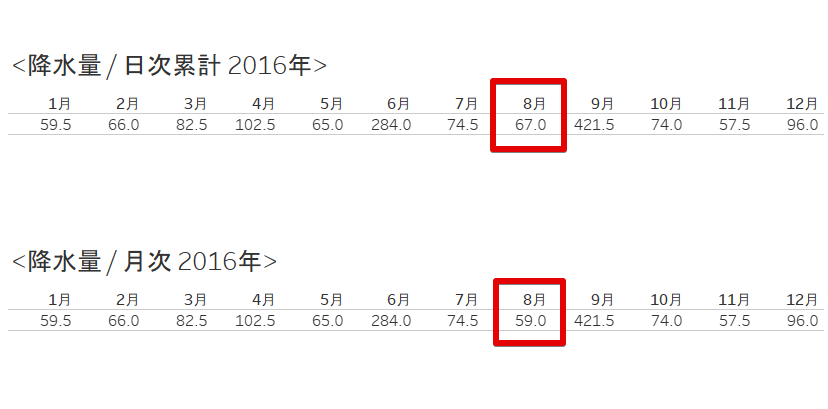
■About mismatching between daily data and monthly data
Since monthly data does not include the data, which is not sufficient due to changes of the observatory locations or changes of machines, some daily data totalized in a month don’t match the monthly data.
The diagram below is the data of Shinkyohama observatory in 2016.
Update History
2022/1/28 : Rename JMA_METEOROLOGICAL_DATA_MONTHLY to JMA_METEOROLOGICAL_MONTHLY